Every home has it: an endless amount of household cleaners and chemicals, mops, dusters, vacuums, cloths and sponges. Each room seems to require a different set of products or tools to get it clean. We organize the rest of our homes, but tend to shove all of our cleaning supplies into whatever closet has some space. Since these products and tools keep our homes clean, shouldn't they be organized and easy to access? By organizing your cleaning materials, you can save space and get your cleaning done faster.
Give Cleaning Supplies a Home
The first thing you should do is dedicate different areas to your different cleaning supplies. If possible, keep your materials on the same floor or even in the same room where you'll use them, but you don't need to put cleaning materials in every room of your house. Rather, use your upstairs hall closet for the bedroom and bathroom supplies.
The supplies you use regularly should be easy to access, so give them a box to sit in or hook to hang on. By giving your materials a permanent home, you will save time by knowing where they are (and avoid multiple trips up and down the stairs).
Separate Your Materials
Not only should you have specific areas for your supplies, you should also organize them by which room they will mainly be used in. For example, all of your kitchen cleaners should be together. If you have limited storage space and have to put a lot of supplies in the same area, label your storage boxes or plastic bins and keep the materials you rarely use in the back.
Keep Hazardous Substances Out of Reach
Hazardous cleaners and chemicals should always be kept out of reach of children and pets—swallowing chemicals could seriously hurt or even kill them. When storing these materials, put them on the highest shelf and keep them in a sturdy box or bin. Never remove the labels; they contain emergency medical information, safety guidelines and directions. Also, don't put household cleaners in water bottles, milk jugs or any other beverage container in which they could easily be mistaken for a drink.
Keep Big Cleaning Supplies in Place
No one likes it when they open a closet door and a broom comes toppling out. It's not only frustrating but also dangerous to both adults and kids. Keep your brooms, dusters, steam cleaners and vacuums in place by installing hooks and wall-mounted holders. If you have the space, consider getting a tool rack that can hold your mop, broom, dustpan and other cleaning tools. It's especially important to store your broom off the floor to minimize bent and broken bristles.
Make the Most of the Space You Have
In an ideal world, we wouldn't have to worry about how all of our cleaning supplies will fit in that tiny closet—actually, in an ideal world we wouldn't ever have to clean at all. But you can make the most of what you have by stacking boxes, using all-purpose cleaners where you can and separating your products by the area of your home in which you use them.
MAX Power! A powerful lithium-ion drill/driver that delivers 0-to-650 RPM and 115 inches-per-pound of torque in a lightweight, easy-to-use package. An anti-slip soft grip and LED worklight makes this tool a delight to use. Check out Black & Decker 20-Volt Cordless Drill/Driver today!
Want to de-clutter your home fast? Here are a few simple things to do in accomplishing a clutter-free home that is organized.
Discover MoreIf you have ever moved, or are thinking of moving, then you know just how stressful an experience it can be. Why add ...
Discover MoreDining rooms are great. What isn't great is the way that they get cluttered and messy. Here are some easy ways to keep ...
Discover More2023-04-24 04:19:48
Peter Atherton
This technique is also used to create Gantt Charts; a Project Management Tool if anyone is interested.
2023-04-23 04:19:48
Peter Atherton
Tomek
Lucid tutorials, great stuff.
Peter
2023-04-22 18:07:25
@Jack Oster
I can send you my test file if you are interested. Just send me an e-mail, or post a comment here with your email unhidden, like mine in this post.
2023-04-22 18:04:15
Tomek
I am trying to post the screenshot for my previous comment again to avoid quality degradation due to size reduction. My original was more than 600px wide, now is less. (see Figure 1 below)
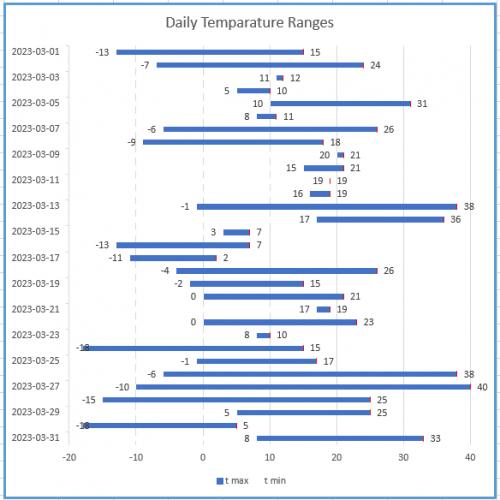
Figure 1.
2023-04-22 17:56:52
Tomek
In my solution I sent earlier, the bar representing the temperature range was invisible if both minimum and maximum temperatures were the same. The fix I suggested required adjusting the underlying data, and that bothered me as not quite right, so I was searching for another way to eliminate this deficiency. What I came up with is the following:
1. Add an error bar to the bars representing the maximum temperature. The easiest way to do this is to select the bars for maximum temperatures, then search for Error Bars in the search box on the top of Excel window, and then select Standard Error. Next, right click on one of the error bars that show up and choose Format Error Bars (you may already have the Task Pane open, which automatically adjusts when you select chart elements). I opted for the horizontal bar in the plus direction only, having a cap, Fixed error Value = 0 (sic!). For the line color you can chose a contrasting color, which will be visible at the end of each bar, or the same color as the bar, which will be essentially invisible, except where the temperature range bar is invisible. The cap of the error bar will likely be slightly narrower or wider than the graph bars, but at least you will see something indicating the temperature for the day when max=min.
2. You can make the graph easier to read, if you add data labels showing the temperatures to both maximum (to the right of the bar) and minimum (to the left of the respective bar) as you can see in the attached screenshot (see Figure 1 below) . I colored my error bars red for better clarity of the picture.
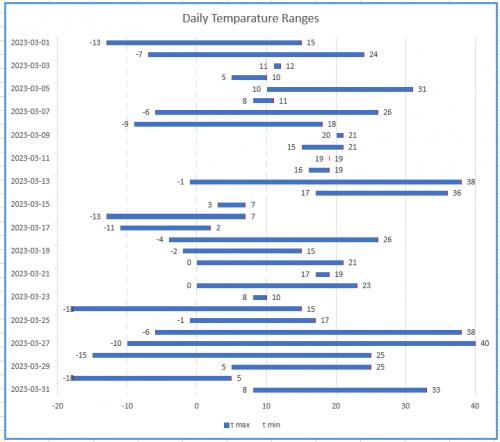
Figure 1.
2023-04-22 17:44:02
Tomek
As Allen mentioned, the first approach works when all temperatures are positive. This may be the case depending where you are, and better chance if you use Fahrenheit scale, like in the USA (or if you are a scientist and use Kelvin ;-). The second approach does work for both negative and positive temperatures but is fairly involved, and requires somewhat complicated logic for the helper columns. It also does not display anything for the days that have minimum and maximum temperatures that are equal.
I have slightly different solution that achieves the same visual effect. Instead of using stacked bars I suggest using clustered bars. They can be formatted to completely overlap, meaning that the one in front will hide part or all of the bar behind it. If you make the front bar the same colour as the background, the graph will display only the part of the second bar that is above the front one. Obviously the front one must be for the minimum temperatures.
The advantage of this approach is that if you move your vertical axis to the left edge, both bars will start at where this axis is (not at zero), hence the display will be correct for both negative and positive temperatures. This behaviour is specific to clustered-bars graph, and does not work with stacked bars.
Below is a step by step guide how to set up such graph:
For the purpose of this I will assume that you have your dates in column A, the maximum temperatures in column B, and minimums in column C. This order is important for the trick to work.
I will also assume that you have consecutive dates in ascending order (although this is not absolutely necessary if they are actual dates, i.e., serial numbers). You also have to make sure that for each date the maximum temperature is not less than minimum.
For the graph to be visually clear, I would suggest maximum of 31 dates, or a month worth of data. If you have more data you may filter them to keep the graph readable.
1. Once you have your data organized, select it (A1:C32 in my example), then chose Insert Tab - in the Chart group click on the small arrow in the lower-right corner, select All Charts, Bar, Clustered Bars and chose the first option.
2. Next, on the graph right-click on any of the bars representing minimum temperatures. Select Format Data Series.
3. In the dialog box that opens chose the icon for Series Options. Set the series overlap to 100%. This will cause the bars to align and the "minimum" bars overlap the "maximum" ones.
4. Select the "Fill & Line" icon. set the fill color for the minimum bars to solid and the same colour as the background (usually white). This will cause the positive part of the graph to look like you wanted, but the negative will be still wrong.
5. To finalize your graph, you need to move the vertical axis to the left of the graph. To do that you need to format the horizontal axis (right click on one of the temperatures on that axis and select format axis). Set the Bounds for the axis to extend beyond possible minimum and maximum temperatures. Set the Verical Axis Crosses - Axis Value to the same as the lower bound. This will cause all bars to extend from the lower bound; in effect the minimum bar will hide the portion of the maximum bar and your graph will look like you wanted.
I am attaching a screenshot of my test spreadsheet (see Figure 1 below) . For better visibility I left the minimum bars as very light gray, except for first three days; I hope this will make understanding my approach a little easier.
If you would like your days to go from top to bottom, format the vertical axis to be in revers order (in Axis Options) and move the horizontal axis to the bottom of the graph if you so desire. The screenshot shows that arrangement.
The graph has the same deficiency that the solution from the tip had: for days when the minimum and maximum temperatures were exactly the same there is nothing displayed. Check the graph for Mar.11 - there is no blue bar there. If this causes a problem, you may want to edit your data, e.g, lower the minimum or raise the maximum temperatures by some negligible amount. I found that 0.05°C worked for the graph above. I have also another solution for that, which I will post separately (this comment is already long enough.
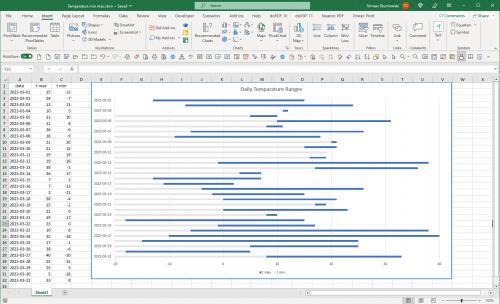
Figure 1.
2023-04-22 15:53:57
Jack Oster
Regarding the fascinating tip re stacked bar charts, named, Creating a Bar Chart for Temperatures, could you by any chance send me the data that you used Allen. I want to see if I can achieve what you have in this tip. Thanks from Jack in Australia.
Copyright © 2023 Sharon Parq Associates, Inc.
Comments